We went out in a group of four, and wandered around, occasionally passing the bundle between us – just to see what it was like, how the vibrations felt, whether people looked at us oddly or didn’t notice, whether we felt friendly and warm towards the bundle or annoyed by it. In the end we wandered arond for an hour or so, everyone taking a couple of turns with the bundle.
The first thing we noticed was that was that holding the bundle gives you an immense feeling of entitlement. Only you can tell when it’s vibrating; only you can interpret its whims. Is it happy? Which way does it want to go? Does it have a name, and if so, what is it? Holding the bundle makes you feel like these are your decisions to make, even when you know perfectly well that the vibrations are random and you’re interpreting them pretty much as you like. It invests you with power.
I’ve been working with the effects caused by the landscape on GPS data to generate line drawings/maps of the terrain for a while now and am feeling the need to push at a few edges and see how else I can apply this phenomenon.
Over the last few days I’ve made the first steps towards making a system that allows the data to be compared and expressed in real time, rather than requiring me to wait until I get back to a (larger) computer to process and visualise the output.
The whole world in my hand - an eye opener to see a stripped-down GPS module and a bit of a brain-bender to try and comprehend what it's capable of doing - so easy to take it for granted when it's hidden away in a satnav or phone...
I’m now the proud owner of a GPS module and a logging shield for Arduino, both of which I’ve managed to get set up and working together to record position.
Testing: GPS module (on the windowsill) sending data by serial to the laptop
The next step is to research – and then make happen! – how to get the Arduino to read from two modules at the same time. Wish me luck.
GPS-triggered thing for a Creative Partnerships interview. We’ll be re-writing entries for a Hitchhiker’s Guide to the Galaxy-esque publication to give more detail on the Earth, Moon and Sun.
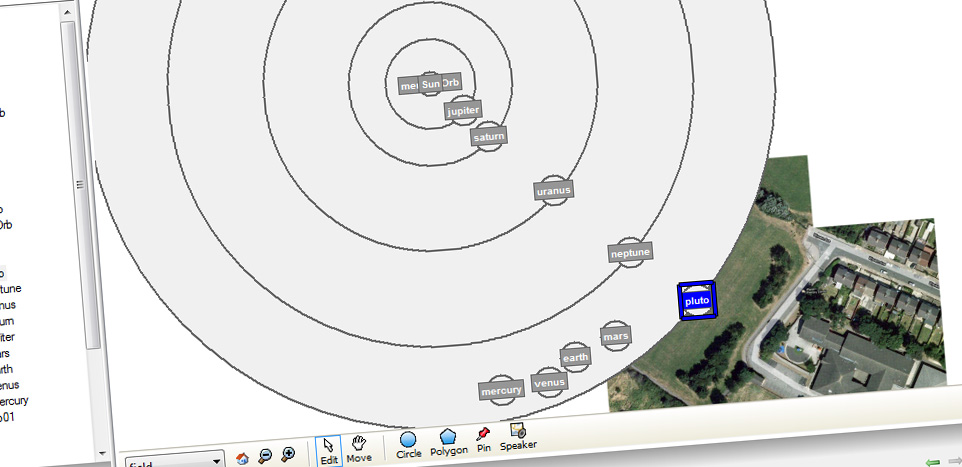
Distance between the sun and Pluto remapped to 212 metres so it fits on the school field. This then makes the distance between the sun and Earth just over 5 metres. Will need to do a zoom, I think...
What started as an exploration into my relationship as an artist to a proposed cultural quarter has expanded to also include a significant amount of sustained investigation into witnessing and documenting the change in that urban landscape.
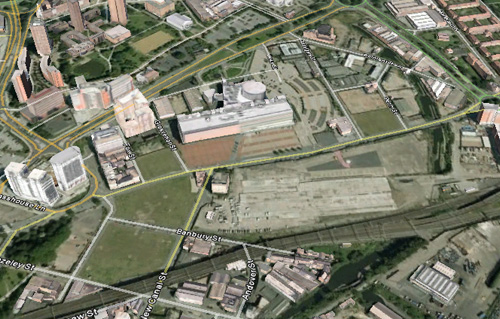
The Google Earth view of the area (with imagery that seems to be from 2007) is already drastically out of date, but it gives a rough idea about the range of contrasting terrain there now.
As well as spending hours walking all the streets in the zone I’ve selected, concentrating on paying attention to the details of the spaces, I’ve been collecting and processing GPS data to use as a measure of how developed the streets are. I will repeat this over the years to come as a way of logging the changes taking place on both macro and micro scales.
Google Earth view of the area I've been investigating
At the bottom left of the image above there is a relatively green area: old factory plots that have now turned to grassy wastelands and the park on the corner at the top of Fazeley Street.
Bartholomew Street, now closed to traffic and without any buildings around it. The bottom right corner shows where my path passes under the railway arches at the corner of Fazeley and New Canal Streets
Here the GPS data is fairly consistent. Water-heavy buddleia bushes overhanging the pavements on closed roads induce a few wobbles and railway viaducts cause momentary loss of signal, but on the whole the open terrain doesn’t interfere much with calculations of position.
Contrast this with the data gathered from around the various Further and Higher Education buildings on and around Fox Street and Grosvenor Street.
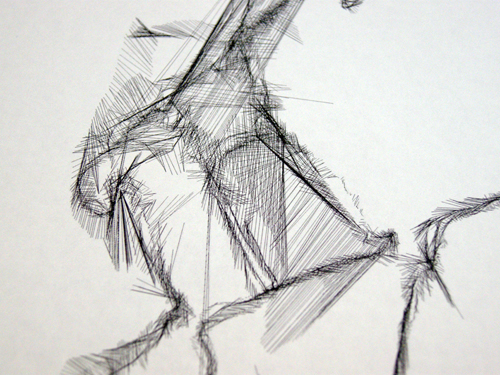
Tall buildings closely packed together reflect and block the satellite signal, causing the GPS calculations for position to be very inaccurate.
At one point one of the GPS devices calculated I simultaneously had one hand next to the halls of residence and the other on Digbeth high street opposite the coach station! (About 800 metres away.)
If even a small proportion of any of the variousplans for Eastside are realised we look set to get more lines like this in the future.
I’ve come to refer to those two areas respectively as the Green Zone and the Learning Zone. The third zone in the area is the Rubble Zone – the plots between Millennium Point and the ring road that have been razed with the exception of 3 buildings: Belmont Row Co-op works, the lock keeper’s cottage and the Moby Dick’s pub.
From left to right: Cardigan Street, Gopsal Street, Penn Street and a tiny piece of Belmont Row. Currently mostly rubble.
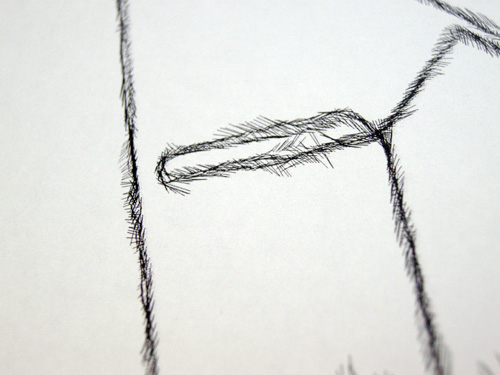
The presence of all three of these buildings can be seen to affect the GPS traces. The image above hints at Moby Dick’s on Gopsal Street. For now the lines are uniformly short, but stand by for Eastside Locks. [link to pdf of proposed developments]
So there we have it: a snapshot of a part of Birmingham before it changes beyond recognition. Quantitative data gathered over several hours of walking a set pattern of streets whilst paying attention to the details, the changes and the people – I’ll tell you about it on a walk or in a pub sometime. Qualitative data in the form of 19, 264 lines that speak volumes if you know how to listen – probably a limited edition print coming soon.
19,264 seconds of qualitative and quantitative data (Curzon Street, 2010)
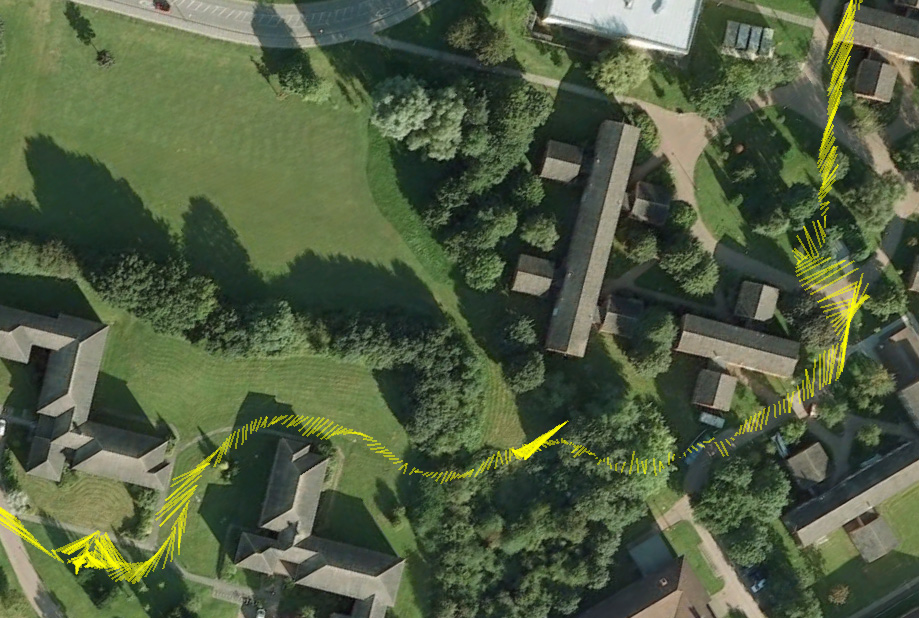
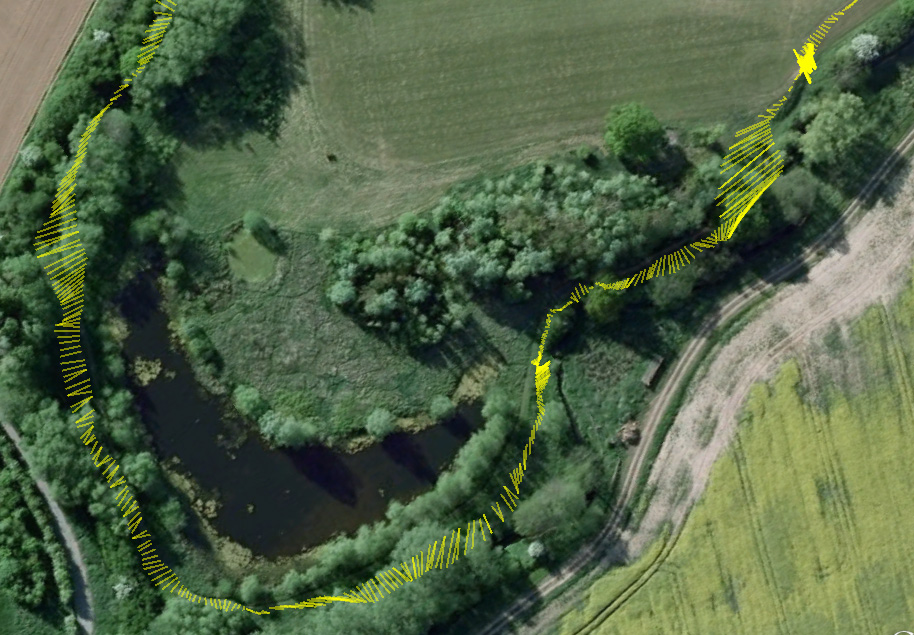
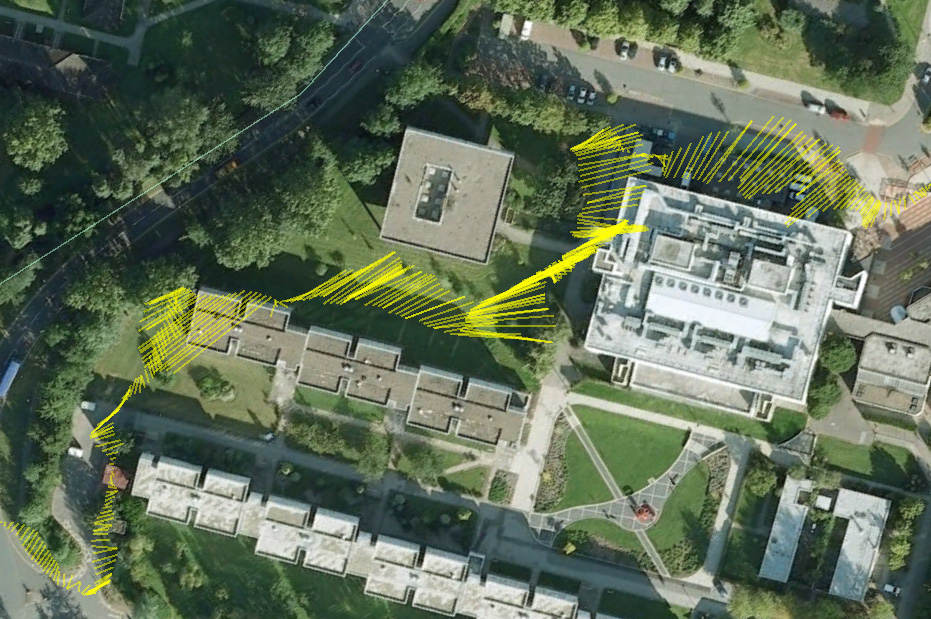
I wasn’t expecting to get much of a trace off them, but it turns out that it worked quite well! Here are a few shots of the data I got overlaid onto Google Earth. If you have Google Earth installed on your computer you can download the .kml file and have a zoom around for yourself.
Jack Martin and Tocil halls of residence, with a few pauses along the way
Walking up Library Road and then walking alongside the WBS Teaching Centre. Is it the trees making the GPS lines longer, or the bricks?
Walking across the fields on the hill, the lines are much shorter as both modules agree more closely in their calculated positions.
A diversion around the lake
Back to civilisation and once again the scattering effect of the buildings can be seen.
I’m still fascinated by how the quality of the lines are affected by the fabric of the landscape and, as shown by the images above, the walk we did covered several different terrains so the resultant drawing has several different characters in different places.
Until yesterday I’d never seen much more of the campus than the Arts Centre, so I found it very difficult to try and relate where I was to Wood’s map of walkable space (with the buildings left as empty space). I’m really pleased that the GPS logging worked so well and I can now figure out where we went and link that back to Traverse Me.
I also like the little clusters of lines that show where we paused and had little conversations. Now I can link thoughts back to where we were when they bubbled up.
Today I was completely fortuitous in stumbling across Jeremy Wood‘s Traverse Me GPS drawing project at Warwick University and the walk and talk event being run this afternoon.
Detail from Traverse Me
I hit send on the email I had been writing, jumped in the car …and managed to get to the Mead Gallery minutes after the group had departed! Luckily though, I located a “tall man with a beard” just outside and managed to join the walk. It’s safe to say that if I hadn’t have spotted them then, then I would never have found them.
Jeremy’s walk took us behind carparks, through hedges and across fields, revealing both the hidden-away secret places and the huge extent of the land owned by the university.
Having spent the last week or two working on another round of walking Eastside using GPS data to map the extent to which the landscape has been built upon, Wood’s work and the discussion around it was great for making me consider my own work.
A central concern of his project (238 miles walked over 17 days) seems to have been to fill in space; casting a network of lines over that which could be walked. Wood says he “responded to the structure of each location and avoided walking along roads and paths when possible”. The resulting mapdrawing – complete with scale mark, title and signature – is covered in swirls, contour-like lines, pictures and spirals.
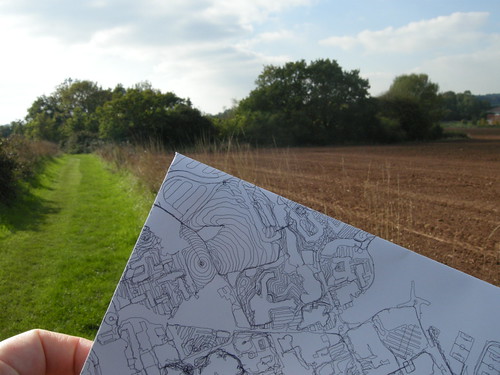
The white "tooth" sticking out from the heavier line on the top left of the map corresponds to the copse. The spiral just below it and to the left originates from the highest point - to the left of where I am stood - and spreads out over the fields.
By contrast, the Eastside walks I’m doing are very much dictated by road layout. As previously observed, Birmingham’s regeneration zone is very much defined by the road boundaries around its edges (c.f. Southampton‘s cluster of relevant cultural organisations).
The more recent work I’ve done to document the development in the Curzon Street area is also very road-centric, using them as a natural (man-made) grid by which to, well, traverse the area I’m investigating. Since I’m interested in measuring change, I need a certain amount of consistency so I can walk the same route in the years to come. Changes in my route have to come from changes in the built environment.
It was nice to hear of similarities in Wood’s experience of recording GPS trails to mine. The way you balance confidence as you stride about an area with deference to the possible intrusions you are causing to the people living and working there; the way you can be intent on following a predetermined route, but can savour the contrivances of circumstance that throw you off your course.
I asked Wood about his thoughts on how he felt the act of carrying a GPS receiver legitimised his erratic behaviour whilst out walking. I’m very aware of how in projects of mine such as Sites of Potentiality Guidebooks, Invigilator and Uncertain Eastside the objects I am carrying or wearing greatly add to my feeling that I have a right to behave a little bit strangely…
I may not want to draw a lot of attention to the fact that I’m holding two PDAs in my hands, but I want them to be visible so people know I am Doing An Art Project.
Having recently also been working on the first Uncertain Eastside publication, I was also curious about the need for telling the stories of the things we see and encounter whilst out on our, largely solitary, walks. The traces from the GPS data are all well and good, but I also want people to know about the security guard at the halls of residence who jokingly asked me if I was counting my steps as I veered around outside his office, or the rain-heavy rhododendron bushes that cause particular squiggles on my drawings.
Today walking and talking events are seeming increasingly important to me as a means to transmit the story of the work.
I’ll be using The Anticipator on Monday to try and locate the source of a mysterious noise, so over the last few days I’ve been dusting off the cardboard hardware and the (now defunct) mscape software.
The Anticipator: now with power indicator, LED bezels and several layers of what I hope will be waterproof spray...
I’ve tarted up The Anticipator a bit to hopefully improve its usability – bezels for the main series of LEDs and also a power indicator. We’ll be using it no matter the weather, so I’ve also given it a few coats of waterproofing. (Not that I’m feeling pessimistic at all, but I’ve also given myself a new waterproof coat too!)
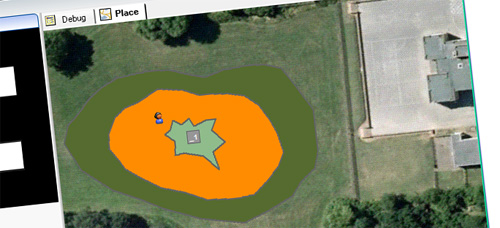
I’ve put together a first draft of the GPS zones I’ll be using over the school field to represent the presence of our mysterious noise-making object and tomorrow I’ll be in Leicester giving it a test run.
School field with GPS zones overlaid
Oh, and we’ll also be testing the field with a metal detector, just to make sure we don’t get any derailing surprises on Wednesday next week when we do it with 50 kids watching!
Using the same dual-GPS process as for Uncertain Eastside, I selected a route that took me through a variety of different urban environments including narrow streets, open wasteland, alongside large buildings and around the foot of the castle.
Wasteland with desire lines
Each circuit of the route (2.2 miles) took approximately 45 minutes to complete and started and finished at the Broadway Media Centre where the event was hosted.
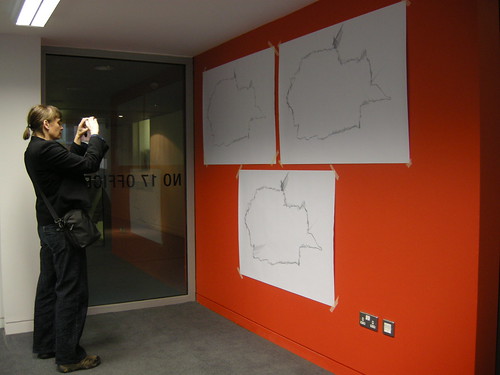
We had a ‘project room’ that we were using as a base for various tech + mapping activities. After each circuit I returned here, processed the data and turned it into a .pdf file that my glamorous assistant Russell would take to the printers whilst I set out walking again.
By the time I returned there would be a new print put up on the wall combining all the traces from all the previous walks.
Cumulative prints of the GPS traces
I only had time for 3 circuits, but my shoes seemed to think that was plenty.
I’m really pleased with the results and had some great feedback and conversations with the other people at the event.
To share a little something of the resultant drawing – and how it relates to the landscape – I’ve added some details from the drawing to the Google Map of my route. Click on the yellow placemarkers to see the image and read the associated text.
Overview of the final route
Detail from the resultant drawing referenced to the part of the route it came from.
So, head on over to the map: zoom in, zoom out, change views, click on things and have an explore!
My main area of enquiry is centred around interactions between people and place: often using tools and strategies from areas such as pervasive games and physical computing to set up frameworks for exploration.
If you'd like to commission me or collaborate with me, please get in touch via the contact page.
General blog contents released under a Creative Commons
by-nc-sa license.
Artworks and other projects copyright Nicola Pugh 2003-2026, all rights reserved.
If in doubt, ask.
The theme used on this WordPress-powered site started off life as Modern Clix, by Rodrigo Galindez.